Tuesday 30 October 2018

Gold at back-test of pitchfork failure line in USD and also at resistance in GBP.

Gold is very close to its back-test of pitchfork failure line from a pattern in force since 2015. Maybe it already happened. Maybe a push to around $1250 would complete it:

It's always difficult to nail these patterns exactly, since it depends if you take daily or weekly charts and if you take intraday or closing prices as the pivot points.
The weekly chart says the high might already be in:
gold pitchforks chart weekly bear market 20181024 26
A little mischief with the above chart might suggest a $970-980 target:
gold possible bear market target on channel doubling Andrews pitchforks 970
Meanwhile, back at the ranch, gold in GBP (pounds) has just nudged to or into the resistance zone above 960; another back-test perhaps? Coincidence?
gold GBP hit 970GBP in resistance zone 960plus

Saturday 18 August 2018

Gold broken down from long term bullish structure since 2010/2011

Gold has broken down from long term bullish structure since 2010/2011.

It looks bad. It looks awful, in fact. The 2016 bull market run could be over according to this - or very nearly.

Targets $1085 or $920 to downside on longer term lower chart.

$1085 is very near $1087 (50% retracement of entire bull market price run from $253 in 1999 to $1923 in 2011).

$920 is the level that comes from a channel doubling of the blue pitchfork, which makes geometric sense and would of course be a new bear market low.

Possibility of a rally to re-test (to back-test) the $1235 breakdown at the bottom of the fork but maybe it has been back-tested already on a smaller scale (upper chart). The gross oversold condition right now might indicate a technical rally. It would be interesting to see if any such rally could make it to $1235+.

The $1235 area was mentioned on an interesting YouTube video here from Alessio Rastani of leadingtrader.com (from Elliott Wave analysis)
Crash in Gold... What Happens Now?


Saturday 7 July 2018

Line in the sand for gold around $1230-1232 or maybe $1238-1240 (Charts).

For me, the line in the sand for this gold mini bull market (or bear market rally?) since December 2015 is around $1230-1232. If this is broken tot he downside, it looks like a much longer correction in the mini bull run. This pattern is 2.5 years old now, 30 months and so you might expect a good year's correction to go on if the uptrend is broken by a move below about $1230-1232.


Andrew's pitchfork giving $1232 as an allowable low but drawing these things can sometimes be not totally precise - and sometimes they are just a little off the trend channel that emerges, just a little, mind:


With a simple trend line, the situation is more tight, $1238 actually breaks the line by a tiny bit intraday:

Going between aily closes (thin red line below) gives the same result actually. $1238 was an intraday dip below the line. Now, where did it close?


The lowest close was around $1240, so gold has just got away with it so far. On the intraday (green line) or daily close level (blue line), the support from the lows last December has held - JUST!


It's hanging on by the skin of its teeth. really marginal here. Is someone looking for that classic pattern that has a false breakout whose name eludes me?

The evergreen http://www.kitco.com site has this for today:
"Bid/Ask 1242.10 / 1243.10
Low/High 1235.80 / 1246.90"
Oops. The intraday support at $1238 was broken to $1235.80. Price has recovered to $1242.10 as of now.
 
Maybe Friday's close is going to tell the story or lead up the garden path if someone paints the charts below the lines inthe sand. However, if they CAN paint the charts, what does that say about the strength of the market?

Tuesday 3 July 2018

Possible coins for sale English Crowns, Halfcrowns, etc.

Possible coins for sale English Crowns, Halfcrowns, etc.

I am posting here pictures of some potential coins for sale, since the pictures are quite large for sending by email.


Firstly 1927 George V Proof Set (6 silver coins), about FDC (Spink 2014 book price £700 in FDC but price negotiable).


Group pictures (scans) are first and some individual coins (photos) are shown below that:

Please click to enlarge:


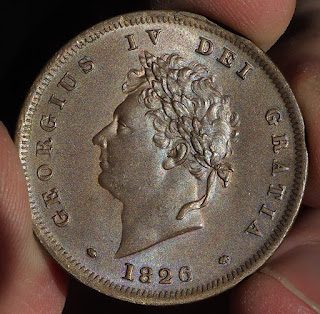
1826 Penny Choice Uncirculated (4 pictures):


1845 Crown cinquefoil stops Choice GEF / AU 
I would estimate an easy potential AU58 (4 pictures):


1820 Halfcrown Uncirculated (4 pictures):


1858 Penny about Unc (2 pictures):


1887 Crown toned Uncirculated (2 pictures):


1853 Sovereign WW relief NGC MS63 (2 pictures)


 1871 Sovereign die#27 ANACS MS63 (5 pictures)


Tuesday 26 June 2018

Oil and gasoline based models for CPI inflation forecasting - reprint 3

No adjustment to models and April CPI inflation comes in very close to my forecasts.

April 2017 USA CPI inflation has come in very close to my forecasts, made on this blog during early April.

No adjustment to models and April CPI inflation announcement on 12 May 2017 comes in at 2.2%, very close to my forecasts made more than a month ago:

http://1000gold.blogspot.co.uk/2017/04/cpi-inflation-forecasts-for-march-and.html

The models I have followed most closely are geometric gasoline and geometric oil with 2 month moving average data being used for the latter. These models forecast 2.28% and 2.33% for April CPI, even without any adjustment in the models to take into account March's figures.

So what we appear to have is slowly falling inflation because of the slowing in year over year increases min oil and therefore gasoline prices. Sub 2% inflation probably beckons (according to the BLS figures anyway) for later in the year, as shown in the above link.

Oil and gasoline based models for CPI inflation forecasting - reprint 2

CPI inflation forecasts for March and April 2017

Here are my inflation model forecasts for March and April USA CPI:
The weakest model is Oil9. The others are quite consistent, using current oil and gasoline price action combined with EIA forecasts for oil and gasoline:

Month Oil8 OIl9 Oil10 Gasol11 Gasol12 CPI BLS actual
Feb'17 2.80 2.75 2.76 2.78 2.81 2.7
Mar'17 2.62 2.29 2.90 2.46 2.51 TBA
Apr'17 2.28 2.12 2.40 2.33 2.38 TBA

March CPI is to be announced any minute now.

US CPI Inflation forecasts for Mar and April 2017. Recorded 13 Apr 2017. These geometric and polynomial forecasts give lower inflation figures than purely linear (striaght line formula forecasts and match Feb's inflaiton well (2.7-2.8% against actual published 2.7%). They indicate figures of 2.5-2.9% for March and 2.3-2.4% for April, except for one outlier.
Linear forecasts for Feb and Mar were around 3.1-3.2 and 3.3-3.5 approx). I have modeified the models therefore to geometric models especially in the light of the bureau of Labor Statistics' US  Consumer Price Index inflation figures using geometric weightings for almost all of its components.

Video here explaining models with charts:
https://www.youtube.com/watch?v=dd5SeKGaX8M

Oil and gasoline based models for CPI inflation forecasting - reprint 1

My first geometric oil models for forecasting US CPI in 2017.


23 March 2017:
I have a new geometric oil model (well, 3 variants, models 8, 9 & 10) that have come up with slightly lower inflation figures than I had forecast before. I was looking into the possible uncertainties in the regression line analysis that undelies the models and there is some, due to the scatter in the data. Anyway, the best estimates are now shown on the following chart until July 2017:

This incorporates oil price data to February 2017 and also EIA forecast prices for the months up until July 2017.

Closer view:


I am now looking at models based on retail and wholesale gasoline prices (including current price action and EIA forecasts)

Also, the two videos are here (that were recorded in advance of the CPI report on 15 March):

Inflation Forecasting and Energy Prices Introduction to Concepts
https://www.youtube.com/watch?v=uZwvaUnwppI

and

CPI inflation forecast models for USA February and March 2017.

https://www.youtube.com/watch?v=F30FOs42J34

Monday 4 June 2018

Taking 1p, 2p penny and twopence out of circulation paves way for pound devaluation.

I recently head about the rumours that low denomination UK coins may be taken out of circulation. Here is one of the articles.

https://fundraising.co.uk/2018/03/15/penny-wont-dropped-copper-coins-remain-circulation/#.WxVzJ9QrLs0

There have been numerous other articles in the 'press' about this but I have heard little or no discussion verbally anywhere.

However I did find some interesting comments here on this Twitter page:
https://twitter.com/bbcpolitics/status/973595466452660225

My reply to the articles would have been this - but in order to reply to these things, it is often necessary to accept all kinds of marketing stuff and use of your information by these websites, just to make a comment. No way. So I'm writing it here:

All of these articles are talking about the shorter term practical consequences of this issue and are not saying "Why?" 
The "Why" is important. It's due to the debasement of the currency and decades of money printing by central bankers and the consequent destruction and robbery from the value of people's savings. It's a national disgrace that the penny - that used to be a big copper or bronze coin - is now worth so little that it can't buy anything. Even back in the 1970s, you could buy a decent 'Bubbly' bubble gum with a penny. Now, I never see anything priced less than 10p in UK shops.
The pound is being prepared for excessive devaluation that will turn it into a "peso." The withdrawal of these 'coppers' that are already made of cheap copper plated steel since 1992 because inflation makes copper too expensive, paves the way for the turning of the pound into a third world type of currency. The penny is not a farthing, or a halfpenny. Those are long gone. It is a penny, THE PENNY, a fundamental unit of our currency. Once it is gone, out of sight and out of mind, watch the pound plummet, until a pound is worth what a penny used to be worth.

Of course, it is also another step towards the cashless Big Brother society where we are being led by the nose. Anything that enables this is hot on the political agenda for the politicians and central bankers. 

However, when there is no cash and the other payments systems hit any kind of major problem, you won't be able to buy anything and may have all kinds of other problems - and you will never know the actual precise cause or be able to do anything about it. Your life will be outside of your control in yet another way. The card payments fiasco in May/June 2018 is a telling and scary example of where excessive belief in government and technology will lead us:

https://www.moneysavingexpert.com/news/banking/2018/06/visa-customers-hit-with-multiple-transactions-on-their-card-after-outage---heres-what-to-do-

https://www.theguardian.com/money/2018/jun/01/visa-card-network-crashes-and-sparks-payment-chaos

As for coin values, the farthing (wthat used to be 1/4 of an old penny, would be worth 2 to 7p by year 2014. So, once a coin is removed the currency is devalued accordingly.

Wikipedia writes (with a reference):
"The purchasing power of a farthing up to its demise in 1960 ranged between 2p and 7p (in 2014 GB Pound values)."

In other words, a modern 2p or even 5p coin is already likely to be worth less than what an old 1/4 penny was worth back in 1960

https://en.wikipedia.org/wiki/Farthing_(British_coin)

Of course, modern society doesn't care about these things, like it doesn't care anymore abut a lot of things that actually matter. It is too concerned with short term pleasures and material gains - and principles are all going out of the window one by one. So, watch the pound become a peso and watch your life savings and pension dissolve into nothingness over the following decades.


Saturday 27 January 2018

Prophet-VS synth fault, some display lights, no sound.

Prophet-VS Fault on switch on, some display lights, no sound. See description below.
Published on Jan 23, 2018
Prophet-VS Fault on switch on, indicators light, then goes to 00, no response or sound. MVI 6727. Fault appeared early 2018 after the unit had functioned for 18 years. Fault came on instantaneously during playing of the arpeggiator.


Emulator III Rack mount version: some sounds and the disk space / memory screens:


Friday 12 January 2018

Gold in British Pounds GBP in no-mans' land near key level £960.

Gold is kind of in no mans' land priced in GBP. I look at the 960 GBP level as being very important as well as the £960-1000 zone in general. This was the support zone before the crash of April 2013.
Gold is oscillating around this level and has been doing so since the Brexit vote:


Thursday 11 January 2018

Is Bitcoin starting to behave like Gold in 2011?

Today's question:
Is Bitcoin starting to behave like Gold in 2011?

Well, no further comments - the chart shows what I mean. Points A, B, C, D and E are similar and the 1,2,3 upward correction looks like a typical Elliott Wave "abc" upward correction following an impulse leg down (CD on the chart):

Perhaps?


Kudos to Jim Wyckoff at Kitco who is doing frequent analysis of the Bitcoin chart nowadays; here for instance:

http://www.kitco.com/news/2018-01-11/Bitcoin-Daily-Chart-Alert-Technical-Damage-Mounting-Jan-11.html

Bitcoin charts are here:
http://www.kitco.com/bitcoin-price-charts-usd/