I was looking for my blog post that had these on but it has disappeared! So I am going to re-post it here:
One remark at the outset is that Fibonacci numbers and the Golden Ratio appears all over the gold action from the years 1968 until 2013 - quite appropriate, don't you think?
One remark at the outset is that Fibonacci numbers and the Golden Ratio appears all over the gold action from the years 1968 until 2013 - quite appropriate, don't you think?
This was my long term gold chart 1968-2013 constructed from Kitco daily London Fix data (early 1970s uses monthly averages - all that was available). I modified it a few times to include the ever-increasing black candlesticks for the 2013 price! Here is the chart for when gold had got down to the 38.2% retracement of the entire bull market:

Next up is my trading screen chart showing almost identical Fibonacci retracement targets. Note that this chart was taken on the day of the 28th June low (the price was $1193 at the moment I took the screenshot). This chart covers the period 1994-2013:
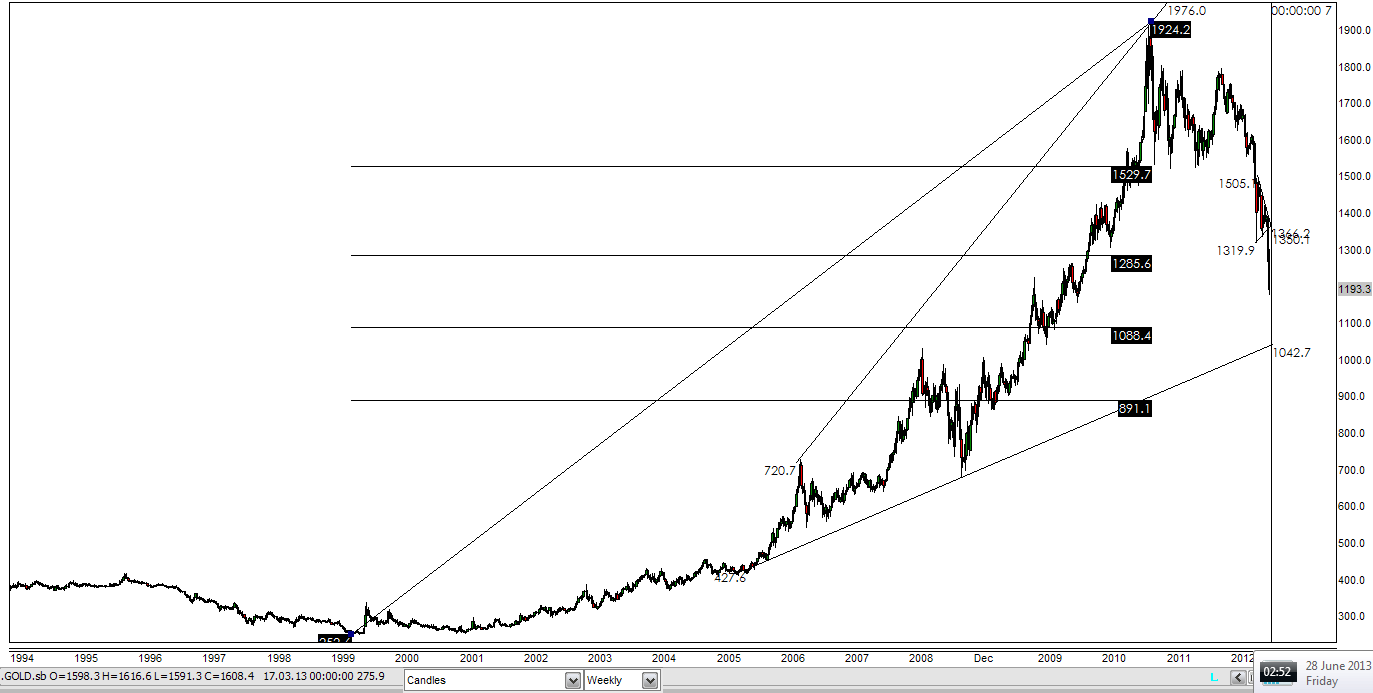
The 38.2% retracement target has been exceeded and the price low still in force today (25 July 2013) is $1180, midway from the 38.2% to 50% targets.
I am still looking out for any formation that could lead price to $1087 or $890, which are the 50% and 61.8% retracements.
Look how the 61.8% correction takes gold back to the exact 1980 gold futures high at $890 from 21 January 1980! Amazing! In that case, the upside at the price peak at $1920 was 1.618 times the downside to the $252 low in 1999. The top at $1920 should therefore have been predictable as a possible important top, a very important one.
Something interesting to note from the second chart is that the 23.6% retracement target was $1529! That is where the major support appeared that was held three times in 2011-2012 and which finally broke down on the mid-April 2013 crash! I had not noticed that before this very moment - I rarely look at the 23.8% Fibonacci target - maybe I had better start!
I fail to understand why many chart technicians still insist on using retracement targets measured from the 2008 low or any other arbitrary point. They have not removed the scales from their eyes. This correction is a correction of the ENTIRE BULL MARKET MOVE, guys! They should have seen that many weeks ago. And
many of these people charge you money for their 'services'?
No comments:
Post a Comment