Monday 7th September 2009 at 18:04
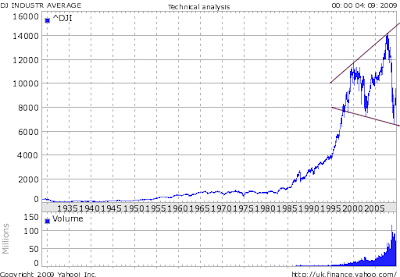
Here are two charts of the S&P500 and Dow Jones with megaphone (top?) formations, as described in my previous post:
Inflation Deflation debate on financialsense.com 2009-09-06
I think that they may indicate increasing episodes of alternating deflation and inflation that may continue to alternate leading to some kind of collapse at the end, because megaphone patterns tend to be bearish and resolve with a breakdown below the lower trendline.
I am going to look for more evidence to see if it is likely that we get alternating inflationary and deflationary episodes during the current crisis and to see if there is any precedent for this.
Dow Jones megaphone:

S&P 500 megaphone? :

Inflation 1980s-2000:
Long term bull market in stocks, bonds and property with few interruptions. Topped 1999-2000.
Deflation 2000-2003:
Small debt defaltion and falling asset prices, stock market crash.
Inflation 2003-2008:
Massive inflation in debt instruments and derivatives, very low interest rates at 1% , huge property bubble, commodities rising, price inflation, rising stock markets, some to new highs.
Deflation 2008-2009:
Larger debt deflation, banks bankrupt, financial panic, stock market crash.
Inflation 2009-now:
Massive injections of liquidity into bankrupt financial systems, ultra-low interest rates of zero-0.25% in USA (similar to Japan in late 1990s to present day). So what happens next?
Deflation? 2010?:
Massive bank failures, debt repudiation, market crashes, negative CPI.
or does the present 2009 trend morph into Hyperinflation?
Here are three of my previous blog posts before last year's panic:
Inflation/Deflation debate is BUNK! 2008-05-29.
Megaphone top in Dow:Gold ratio? 2008-06-03
Chart hints at Financial Disintegration: 2007-12-23)
No comments:
Post a Comment