It's 9 years since the total eclipse of the Sun in England (where it rained, of course) on 11 August 1999. Today gold is being eclipsed and rained on in no uncertain terms, together with most of the commodities.
Did you read anywhere else of downside targets in the $840s from a Head and Shoulders pattern? Or were most or all the 'tout' commentators talking their books, telling you to buy at $880 despite this most obvious chart pattern, as obvious as it gets.
My downside target(s) of $861 and $844 have both been met and exceeded. In fact, the $844 target even allowed for more or less holding around the old all-time high of $850. However, the price plummeted from the $860s and sliced through this lower $844 target all the way to $820, without any pause around $850 at all. Even I didn't really expect that, although $844 is below the previous recent lows (the lowest at $846.40) and below the 21/1/1980 all time high ($850), which might suggest further breakdown(s). It might however also have indicated a possibility to abort the H&S in the $850s, but no such luck!
If we get a bounce at around $800, the chart will form a downtrend channel with two tops and two bottoms (see below).
I had thought the Point and Figure chart (see stockcharts link below) was looking a bit weak and stuttering in the uptrend. I see now that there is a descending triple bottom breakdown from 5 August 2008.
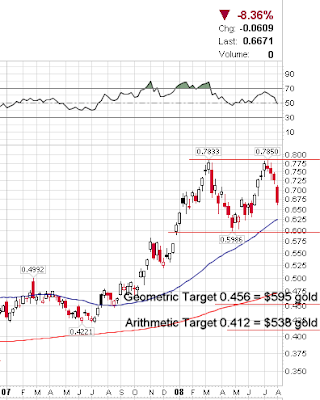
Note also the magnificent double top in the Gold:S&P500 ratio at the bottom of this weekly chart:
http://stockcharts.com/charts/gallery.html?%24gold

James Turk was on Jim Puplava's show some weeks ago, saying that 2008 resembles 1974 in many ways. He then came up with his targets for gold at $1500 spike in 2008 and ending the year at $1100-$1200. What he didn't mention was that 1974 was the start of an intermediate term 18+ month bear market when gold fell from $195 to $103 (not far off -50%). If this is 1974 again, get your flares out, put on the last Peter Gabriel Genesis double concept album from that year and wait for $550 gold!
Now, consider if the gold:S&P500 double top formation were to break down:.

The above is a log graph so I shall do the calculation geometrically (with ratios) and arithmetically (by differences) and use today's close of the S&P500 of 1305.32 to convert the gold:SPX ratio into a gold price target:
Geometric:
0.784/0.598=1.311 (measured move ratio)
0.598/1.311=0.456 gold:SPX target.
0.456*1305.32=$595.22 gold target
or
Arithmetic:
0.784-0.598=.0.186 (measured move amount)
0.598-0.186=0.412 gold:SPX target.
0.412*1305.32=$537.79 gold target -
WOW! That's the 45+% retracement like 1974-1976!
http://www.cbsnews.com/stories/2007/03/07/business/marketwatch/main2543127.shtml
"And I'm hovering like a fly, waiting for the windshield on the freeway ... "
No comments:
Post a Comment